Although Elasticsearch and the Elastic Stack are my specialty, I’m also part of the enterprise monitoring team at APS — and that work has made clear that monitoring isn’t just a nice-to-have for production systems. It’s the difference between knowing something is broken and finding out the hard way. That mindset carries over to a homelab, where there’s no NOC watching dashboards and no on-call rotation to catch the 3am disk-full event.
This post covers a full overhaul of homelab monitoring: migrating from a fragile TrueNAS-hosted setup to a proper Kubernetes deployment, organizing monitors by service tier, building intelligent alerting, and solving some tricky v2 quirks along the way.
Why TrueNAS Was the Wrong Host for a Monitor
The previous Uptime Kuma instance ran as a Docker container inside TrueNAS, exposed through Nginx Proxy Manager on the same host. This worked, but it had a structural problem: the monitoring system shared a failure domain with the storage layer it was supposed to be watching.
If TrueNAS had a problem — a disk event, a network glitch, a failed app update — the monitoring system went down at the same time as the thing it was monitoring. That’s the opposite of what a monitoring system is for.
The rest of the stack had already moved past this model. The Kubernetes cluster runs across four worker nodes with no dependency on TrueNAS for availability. Traefik handles all ingress with real redundancy. The obvious move was to bring Uptime Kuma into the cluster as a proper workload.
The migration also meant taking a version jump. The TrueNAS-hosted instance was running 1.23, while Uptime Kuma v2 had been out for months. The Kubernetes deployment lands on v2 from the start.
The Kubernetes Deployment
The deployment itself is straightforward: a single-replica pod with a PersistentVolumeClaim for SQLite data, exposed through a Traefik IngressRoute. The one non-obvious requirement is the NET_RAW capability — without it, ICMP-based ping monitors silently fail because the container can’t open raw sockets.
securityContext:
  capabilities:
    add: ["NET_RAW"]
One thing to watch with Uptime Kuma’s Docker image: the latest tag is permanently pinned to 1.x. It will not pull v2. The 2 tag is what tracks the current v2 release line. This tripped up the initial deployment — the pod came up reporting 1.23.17 while the TrueNAS instance reported 2.2.1 on a different image pull.
The manifests live in the homelab GitLab, managed the same way as the rest of the cluster — GitOps all the way down.
Organizing by Service Tier
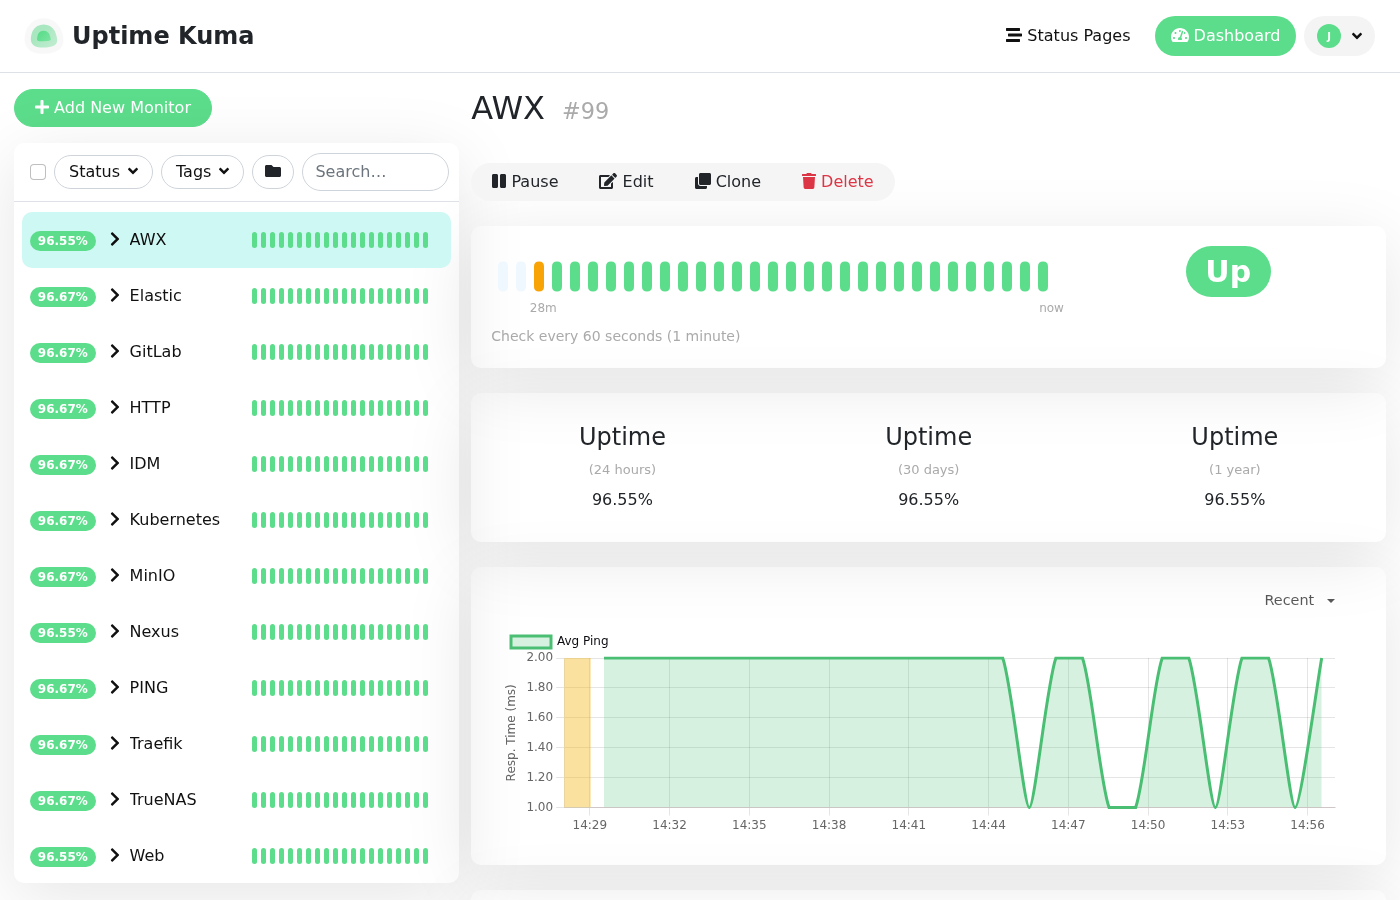
Rather than a flat list of monitors, v2’s group feature makes it easy to organize by service. The final structure ended up with eight groups:
| Group | What It Covers |
|---|---|
| IDM | LDAP, LDAPS, Kerberos, DNS, CA/OCSP — one monitor per port per node |
| Elastic | Cluster health, node count, disk capacity, Kibana, Fleet |
| GitLab | Health checks, readiness probes (DB, Gitaly, Redis, cache), API, registry, Sidekiq, runners |
| Traefik | Dashboard, ping endpoint, health check API |
| TrueNAS | Web UI, SMB, NFS, S3 |
| AWX | Web UI, API ping |
| MinIO | Health and liveness endpoints |
| Web | Production and dev instances of burnedworm.com and initechadvising.com |
The IDM group is the densest. Red Hat IDM is critical infrastructure — LDAP is how every service authenticates, Kerberos is how most of them get tickets, and DNS is how they find each other. Having a per-node, per-protocol view means a single node issue shows up immediately and visually. During setup, a firewalld rule missing port 8080 on one IDM node showed up as exactly one down monitor in the CA/OCSP row. That kind of precision is hard to replicate with a single high-level “IDM is up” check.
Monitoring Elasticsearch Differently
Most monitors in the stack are straightforward — HTTP checks, TCP port checks, JSON response validation. Elastic adds a layer of complexity because the interesting health data lives in structured API responses that need to be queried, not just checked.
Uptime Kuma v2 uses JSONata for its JSON query monitors, which is a meaningful change from v1’s JSONPath support. JSONata is an expression language rather than a path syntax — more powerful, but the filter expressions look nothing like JSONPath. Any existing v1 JSON monitors that used path filters needed to be rewritten from scratch for v2.
The disk space monitor is a good example of where this matters. The Elasticsearch _cat/allocation API returns one row per node, each with a disk.percent field. The goal is to alert if any node exceeds 80% disk usage. In JSONata:
$max($[].$number(`disk.percent`)) >= 80 ? "ALERT" : "OK"
There’s a subtlety here: disk.percent is returned as a string, not a number — so $number() is required before any comparison. The JSONata expression grabs all values from the array, converts each to a number, takes the max, and evaluates to either "ALERT" or "OK". The expected value is "OK".
Getting this working also surfaced a v2 quirk: monitors created through the socket.io API have an empty json_path_operator field in the underlying SQLite database, which causes them to silently report “Invalid condition null” in the heartbeat log. The API ignores the jsonPathOperator field on edit — the only fix is a direct SQLite update on the pod, followed by pausing and resuming the monitor to force a reload.
Alerting That Scales
The notification setup uses Resend via a webhook. The problem with a generic email alert is that every alert lands with the same subject line — they collapse into a thread in Gmail and the inbox becomes useless at a glance.
Uptime Kuma v2’s webhook notification supports Liquid templating, which lets the email subject be dynamic. The final template:
Subject: [{{ status }}] {{ name }}
Every alert now arrives as its own distinct thread: [DOWN] GitLab - HTTP - Health and [UP] GitLab - HTTP - Health are immediately identifiable without opening the email. At scale, this is the difference between useful alerting and alert noise.
The other tuning decision was around retry thresholds. A monitor that runs every 60 seconds and alerts on the first failure generates a lot of noise during normal deployments — Kubernetes rolling updates, pod restarts, certificate renewals. The configuration:
- 60-second interval monitors: alert after 10 consecutive failures (10 minutes of actual downtime)
- 5-minute interval monitors (disk space, slower health checks): alert immediately
This keeps deployment noise low while still catching real disk-full events, which don’t resolve on their own.
The Result
The dashboard now shows roughly 50 monitors across eight groups, all green. More importantly, every critical failure domain in the homelab has at least one check: if IDM loses LDAP, it shows up immediately. If Elasticsearch has a disk problem, it alerts before it becomes a full-disk crash. If a Kubernetes deployment breaks a service, it trips the threshold within ten minutes.
The tooling is Kubernetes-native, version-controlled, and not co-located with the thing it’s watching. That’s the baseline for monitoring that’s actually useful — in a homelab or anywhere else.
Jeremy Blackburn is a systems and infrastructure engineer and principal of Initech Advising LLC. He helps organizations modernize infrastructure and build reliable platforms at scale.